H3-Cities: A Tool for Multi-Scale Urban Analysis
A web tool to subdivide any city into consistent, multi-resolution hexagonal grids using Uber's H3 and OpenStreetMap, supporting scalable urban research.
Overview
h3-cities is a web-based tool designed to address a common challenge in urban computing: the lack of consistent spatial units for cross-city analysis. Administrative boundaries like ZIP codes, neighborhoods, or census tracts vary dramatically in size and shape from one city to another, making direct comparisons difficult.
This tool integrates OpenStreetMap with Uber’s H3 Hexagonal Hierarchical Geospatial Indexing System to partition any city into a grid of uniform hexagonal cells. This enables consistent, multi-scalar urban analysis, a methodological need highlighted in our research.
Key Features
- Consistent Multi-Resolution Grids: The tool allows you to select from multiple levels of spatial granularity. The resolutions tested in our work include:
- h6: ~36.12 km²
- h7: ~5.16 km²
- h8: ~0.74 km²
- h9: ~0.11 km²
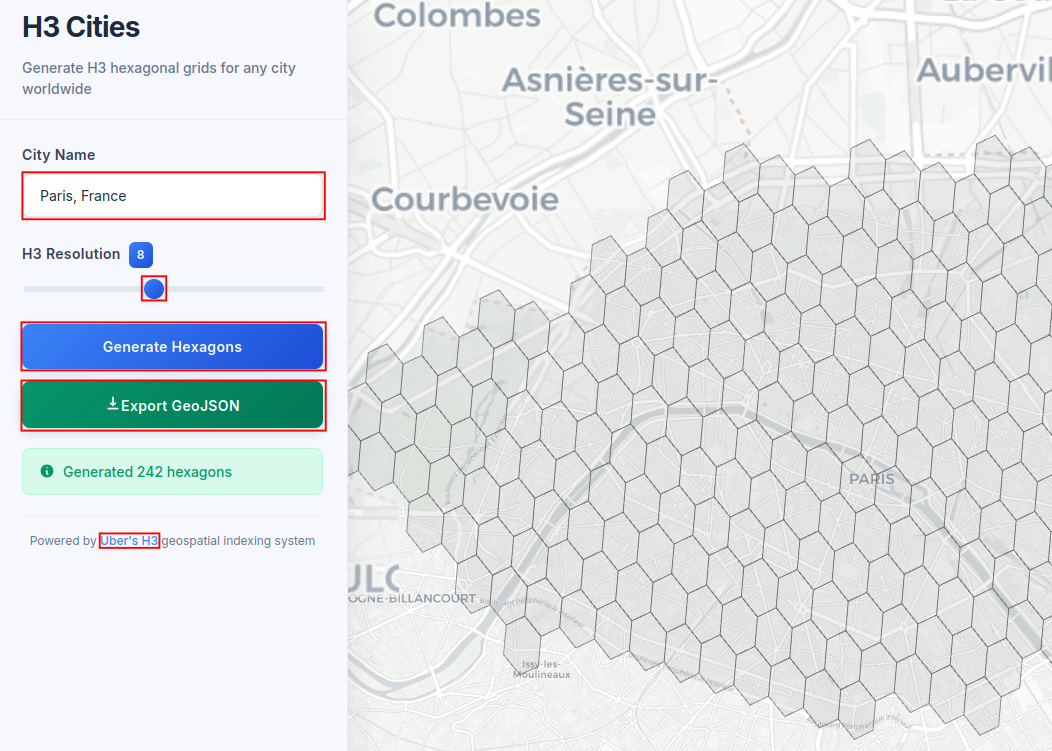
- Simple Web Interface:
h3-citiesis designed for ease of use. You can generate and download hexagonal grids for any city in a few clicks. - Visual Preview: The tool provides an instant visual preview of the hexagonal grid overlaid on the selected city or region.
- Powered by H3 and OpenStreetMap: It leverages the geometric advantages of the H3 system and the comprehensive map data of OpenStreetMap to provide accurate and useful geospatial data.
How to Use
The tool offers a straightforward workflow for researchers and analysts:
- Navigate to the h3-cities website.
- Enter the name of the desired city or region.
- Select the hexagonal grid resolution (e.g., h6, h7, h8, or h9).
- An interactive map will display a visual preview of the resulting grid.
- Use the download option to retrieve the hexagonal cells as a file for use in your GIS software or analysis scripts.
Visual Demonstration
As shown in our paper, the hexagonal grids provide a uniform alternative to traditional administrative units, which can be irregular. The image below compares H3 resolutions (h6-h9) with Census Tracts and ZIP Codes in New York.
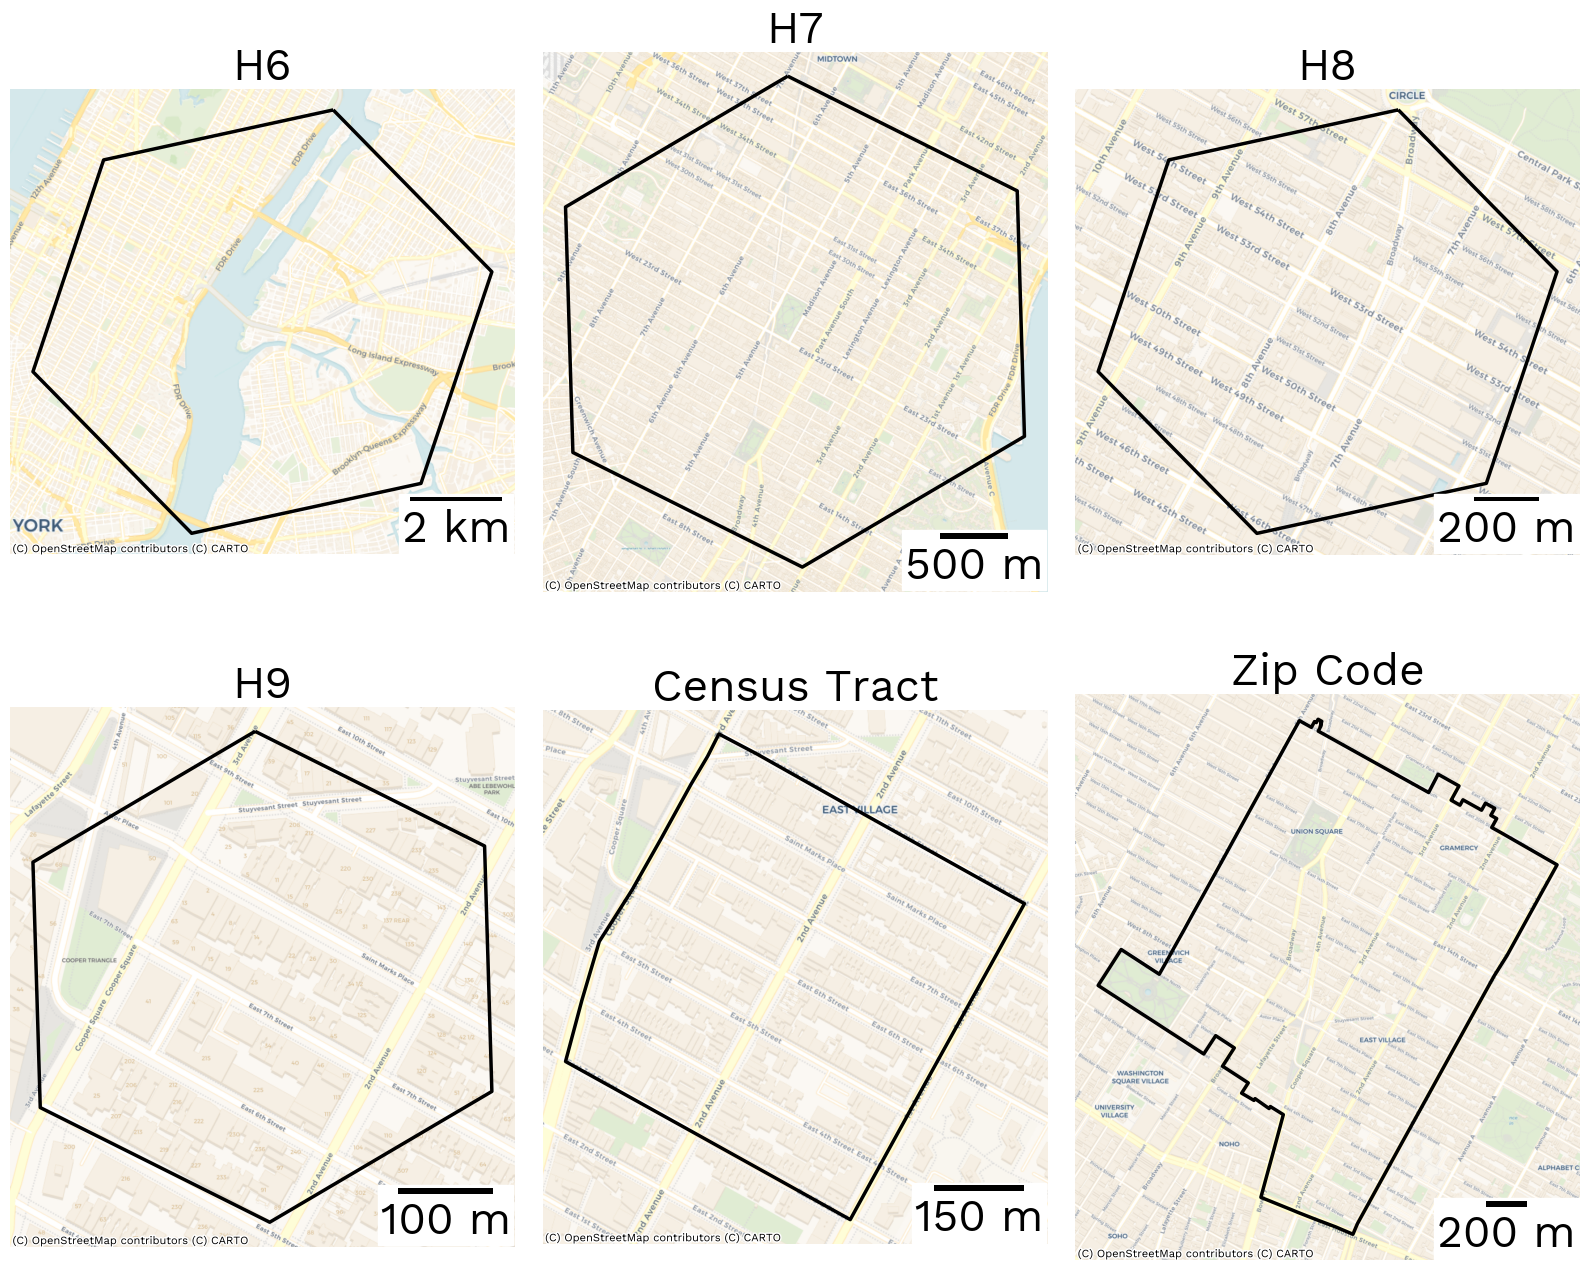 Figure 1 from our paper: A visual comparison of different granularity levels in New York.
Application in Our Research
h3-cities was essential to the research presented in our KDD 2025 paper, “Interest Networks (iNETs) for Cities.” We used the tool to create iNETs at multiple spatial scales for cities in the U.S., the UK, and Brazil.
This multi-level approach was critical for validating our models across different platforms (Google Places and Foursquare). Our findings revealed:
- Coarser granularities (like h6) show more consistent patterns of urban interest across different LBSNs. [cite: 3, 138, 185]
- Finer granularities (like h8 and h9) expose more subtle, platform-specific user behaviors. [cite: 3, 139, 185]
By enabling this analysis, h3-cities provided a foundation for developing our scalable, explainable recommendation system.
Publication
This tool was essential for the following publication:
Title: Interest Networks (iNETs) for Cities: Cross-Platform Insights and Urban Behavior Explanations
Conference: Proceedings of the 30th ACM SIGKDD Conference on Knowledge Discovery and Data Mining (KDD ‘25)
Authors: Gustavo H. Santos, Myriam Delgado, and Thiago H. Silva