Interest Networks (iNETs) for Cities: Cross-Platform Insights and Urban Behavior Explanations
Interest Networks (iNETs) for Cities: Cross-Platform Insights and Urban Behavior Explanations
CityHood Link: https://cityhood.vercel.app
H3-Cities Link: https://h3-cities.vercel.app
Poster Link.
Abstract
Location-Based Social Networks (LBSNs) like Google Places and Foursquare offer a treasure trove of data for understanding how people move through and interact with cities. We introduce Interest Networks (iNETs), a powerful model that captures how user interests are distributed across urban spaces by analyzing co-visitation patterns. This study performs a comprehensive comparison of iNETs across different platforms and spatial granularities (from large city zones to fine-grained hexagonal grids).
Our findings show that while coarser views reveal consistent patterns across platforms, finer granularities uncover subtle, platform-specific behaviors. We discovered that user interest is primarily driven by geographic proximity and venue similarity, while socioeconomic and political contexts play a surprisingly smaller role.
Building on these insights, we developed a multi-level, explainable recommendation system that predicts high-interest urban regions for different types of users (e.g., “explorers” vs. “returners”) and explains its recommendations.
Have you ever wondered what gives a neighborhood its unique vibe? Why do you gravitate towards certain parts of a city and not others? Is it the people, the shops, the parks? At the 30th ACM SIGKDD Conference on Knowledge Discovery and Data Mining (KDD ‘25), one of the top conferences in our field, we presented our research that uses massive datasets to answer these very questions.
Our work introduces a concept we call Interest Networks (iNETs), a powerful way to see how people’s interests and movements shape the living, breathing map of a city. This post will walk you through our KDD poster, diving deeper into our methods, our most exciting findings, and the real-world tools we built.
The Big Picture: Our Research Poster
First, here’s a look at the poster we presented. We designed it to tell a story, moving from the core questions on the left, through our methodology in the middle, to our key findings and the tools we developed on the right.
 Our KDD ‘25 poster, summarizing the journey from raw location data to explainable urban insights.
Decoding the City: What Are Interest Networks (iNETs)?
So, what exactly is an iNET?
Think of it like a social network, but for places instead of people. In an iNET, a “node” isn’t a person, but an urban area—like a neighborhood, a ZIP code, or even a small hexagonal grid cell. An edge, or a link, connects two areas if the same people have visited both. The more people who co-visit two areas, the stronger the connection, or “interest,” between them.
This simple but powerful model allows us to transform millions of anonymous check-ins and reviews from platforms like Google Places and Foursquare into a dynamic map of a city’s interests.
 How we build an iNET. We start with individual user activity (a), find users who visit the same pairs of regions (b), and aggregate this into a network where the edge weight shows the strength of the connection (c).
This raised our central research questions: Can we use iNETs to understand what drives interest in urban areas? And do different platforms like Google and Foursquare tell us the same story about a city?
📣 Key Finding in a Box
Across all our analyses, two factors consistently stood out as the primary drivers of urban interest:
- Geographic Proximity: We are creatures of convenience. People overwhelmingly prefer to visit places that are close to each other.
- Venue Similarity: We like what we know. Interest is high between areas that offer similar types of places (e.g., two neighborhoods both known for their restaurants and cafes).
Surprisingly, factors like socioeconomic status, income levels, and even political polarization had a much weaker influence on where people choose to spend their time.
Our Method: From Raw Data to Urban Insights
To build our iNETs, we analyzed a massive amount of data: over 600 million reviews from Google Places and millions of check-ins from Foursquare across the USA, London, and Curitiba, Brazil. We then enriched this data with socioeconomic, cultural, and political information for each region.
A Deep Dive into “Granularity”
A key part of our work was analyzing the city at different zoom levels, a concept we call spatial granularity. Think of it like adjusting the focus on a camera. A “coarse” granularity looks at large areas like city boroughs, giving you a big-picture view. A “fine” granularity zooms in on tiny hexagonal cells, showing you micro-level behaviors.
We used both administrative boundaries (like ZIP codes and neighborhoods) and a flexible hexagonal grid system from Uber called H3.
 A comparison of different spatial units in New York. From large H3 hexagons (H6) to tiny ones (H9), alongside traditional ZIP codes and Census Tracts. Choosing the right scale is crucial for analysis.
Results: The Zoom Level Matters!
When we compared the iNETs from Google Places and Foursquare, we found something fascinating.
At a coarse level (e.g., large city districts), both platforms told a very similar story about which areas were popular and connected (high correlation). But as we zoomed in to a finer granularity, their stories began to diverge, revealing subtle, platform-specific behaviors. This suggests that while broad urban trends are universal, the micro-rhythms of a city are captured differently by different communities of users.
Beyond Borders: Introducing Urban Preference Zones (UPZones)
City-defined neighborhood boundaries are often based on historical lines, not how people actually use the space. We thought: what if we let the data draw the map?
This led us to create Urban Preference Zones (UPZones). Using a community detection algorithm, we identified clusters of small, adjacent grid cells that were densely connected by user traffic. These UPZones represent behaviorally coherent areas that often transcend official borders.
Our London case study was a perfect example. The UPZones our model identified mapped beautifully to well-known functional areas.
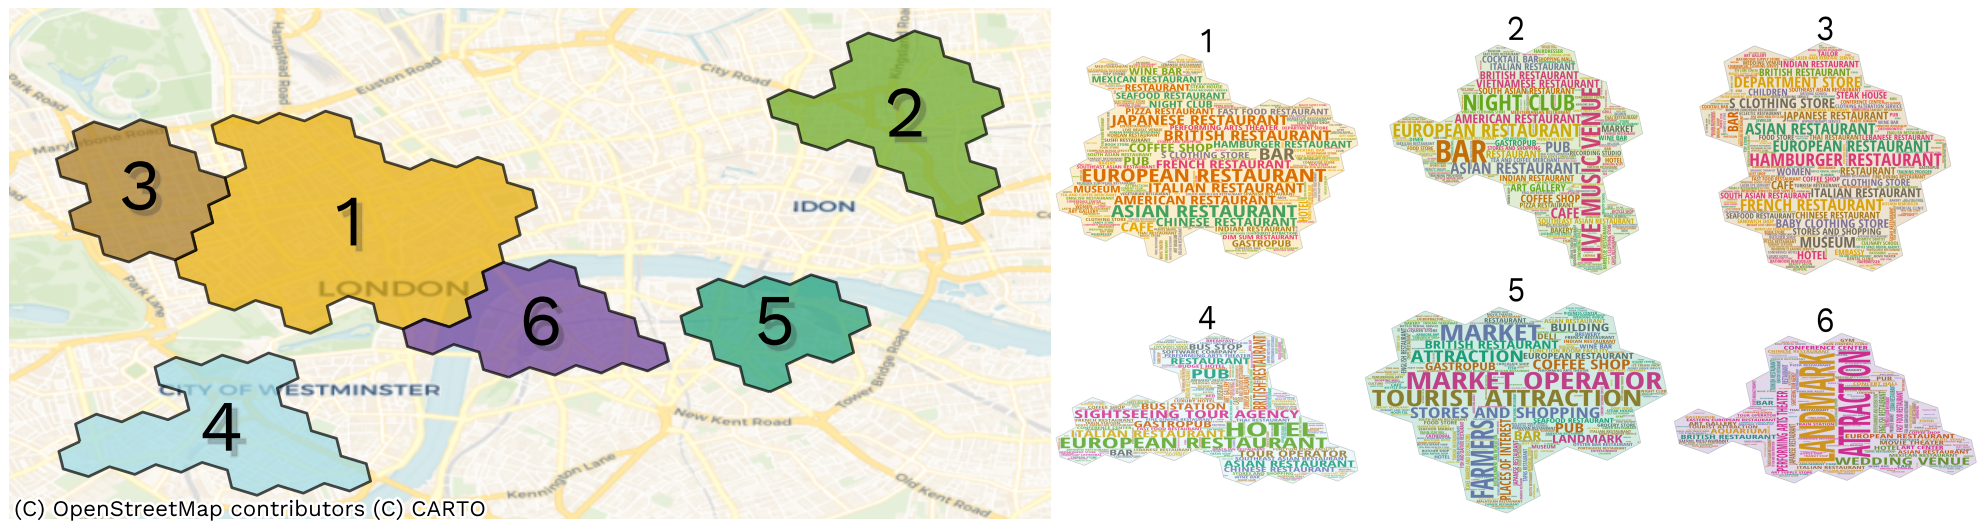
Our algorithm identified these UPZones in London. Rather than following administrative lines, they map to functional areas like the Soho nightlife district (1), the high-end retail hub of Mayfair (3), and the South Bank cultural area (6). The word clouds reveal the dominant types of venues in each zone.
From Groups to Individuals: Personalized Recommendations
After understanding city-wide patterns, we zoomed in on the individual. We wanted to predict which new areas a specific user would find interesting. To do this, we first distinguished between two types of user behavior:
-
Returners: People who tend to stick to a few favorite, familiar places.
-
Explorers: People who are constantly seeking out new areas and experiences.
We then trained a machine learning model (a LightGBM classifier) to predict whether a region would be “high-interest” for a user based on their past activity. And thanks to explainable AI (XAI) techniques, the model doesn’t just give a recommendation; it explains why.
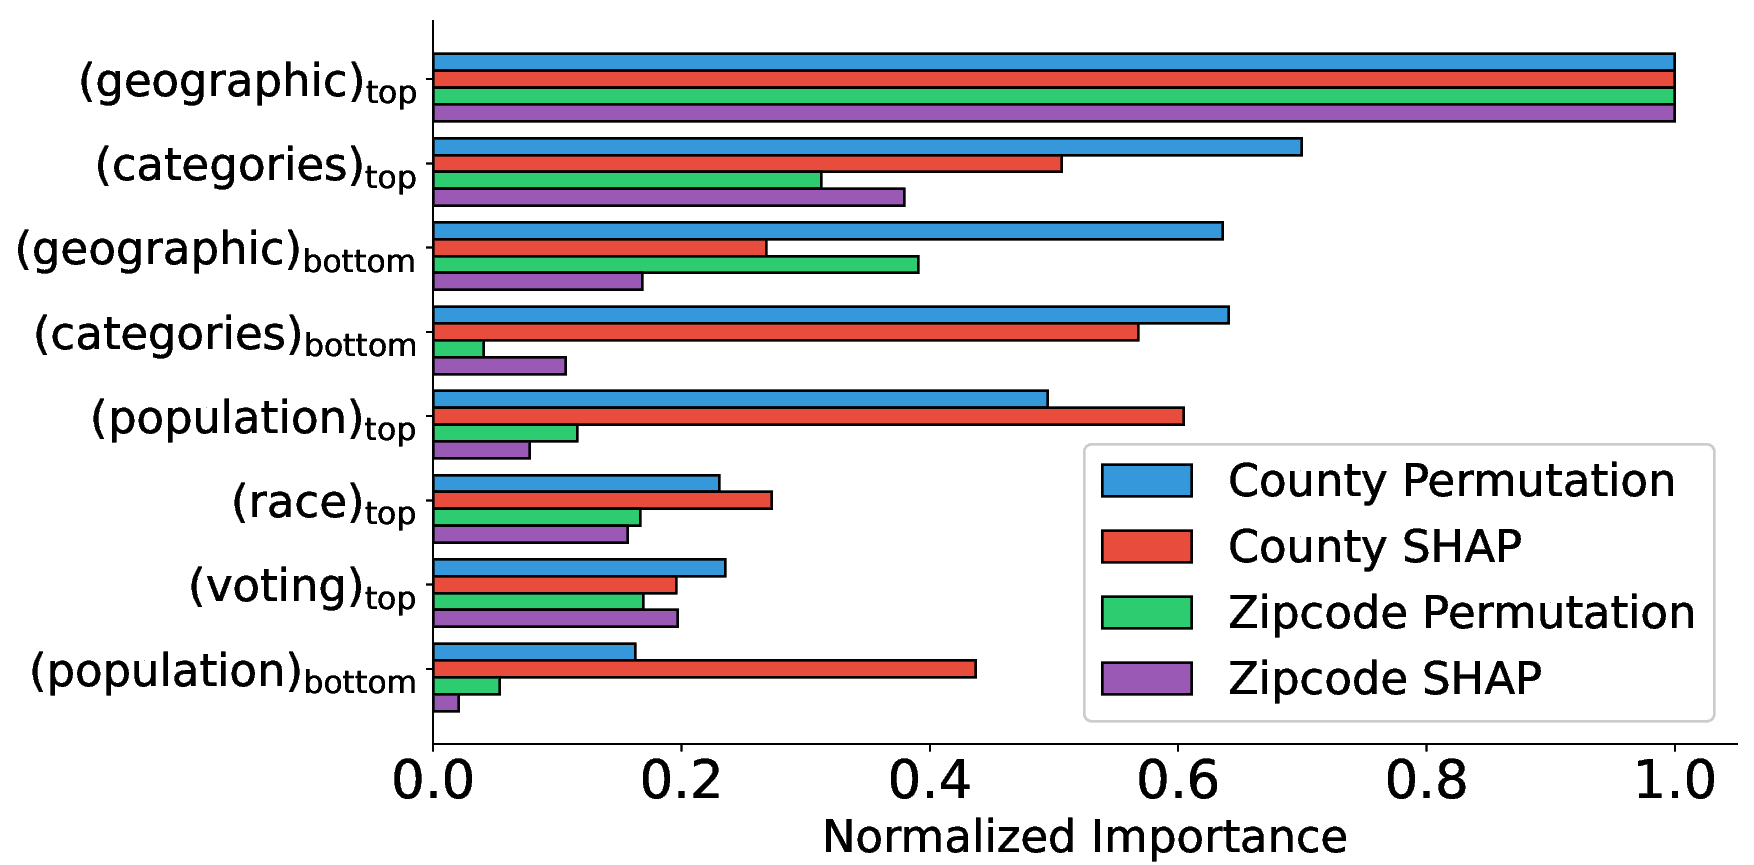 What factors predict a user’s next favorite spot? This chart shows that distance to places they already love ((geographic)top) and the similarity of venues ((categories)top) are by far the most important predictors for our model.
Interestingly, the model was more accurate for explorers, who are driven more by geographic proximity to other places they like. Returners, on the other hand, are more influenced by finding areas with similar types of venues, regardless of distance.
Impact and Our Contribution: Meet CityHood
To bring all this research to life, we developed two key tools:
-
h3-cities: An open tool for researchers to easily segment any city in the world into hexagons for multi-scale analysis.
-
CityHood: A public demo that showcases our recommendation system. It allows users to get personalized city and neighborhood recommendations, complete with AI-powered explanations for why a place might be a good fit for them.
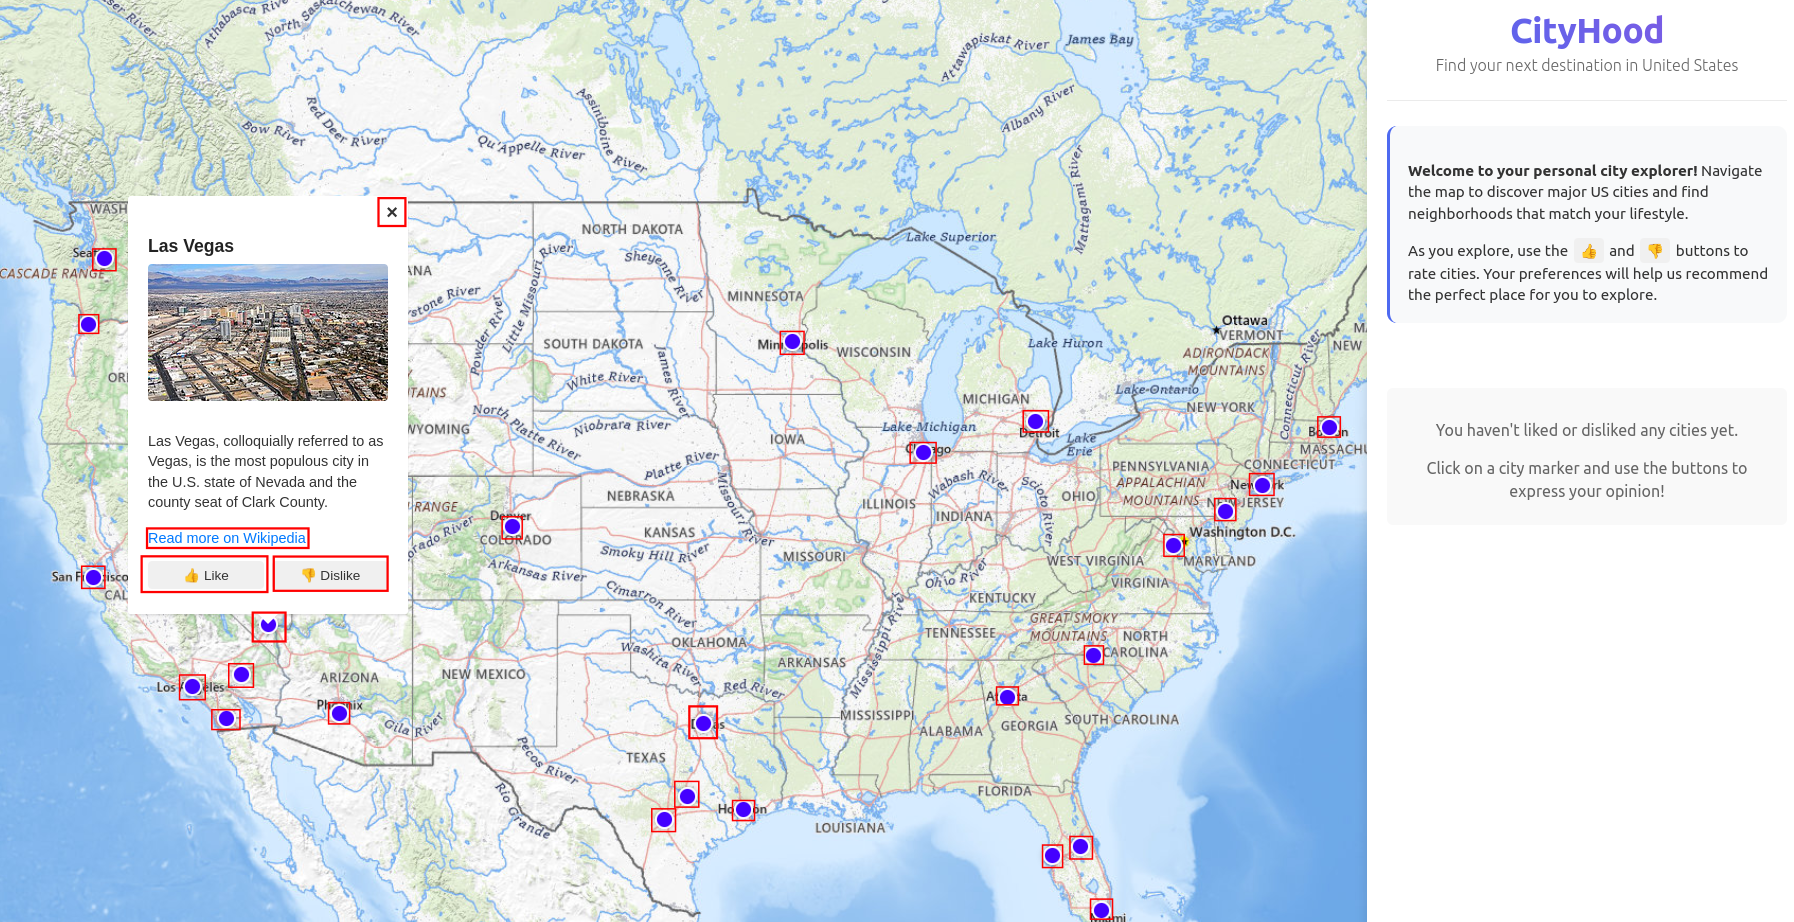 A sneak peek at our CityHood demo, a tool that provides personalized city and neighborhood recommendations with AI-powered explanations.
Conclusion & What’s Next?
This research offers a new lens through which to view and understand our cities. Here are the key takeaways:
-
iNETs are a powerful and scalable way to model urban behavior using LBSN data.
-
The lifeblood of a city’s interest map is primarily geographic distance and venue similarity.
-
The “right” map scale matters. Coarse views show general patterns, while fine-grained views reveal unique, platform-specific behaviors.
-
We can let data define more meaningful “neighborhoods” (UPZones) based on how people actually move and interact.
-
This framework can power the next generation of smart, explainable, and personalized recommendation systems.
Our journey isn’t over. We plan to integrate textual reviews using NLP, incorporate time-aware mobility patterns, and validate our findings with local urban planning experts. Our tools and datasets provide a foundation for exciting future work in urban computing, mobility modeling, and recommender systems.
Discaimer: I’ve let Google Gemini write a fun overview of the paper, but for a proper reading, please, refer to the paper.